Building a Business Dashboard: Real-Time Insights to Supercharge Productivity
- What is a Business Dashboard?
- Why Do You Need A Business Dashboard?
- Must-Have Key Features of a Business Dashboard
- How to Create a Business Dashboard Using BI Tools
- How to Create Your First Business Dashboard with Flowlu
- Top Use Cases for Dashboards
- Dashboards for Results
- Why Use Flowlu for Your Business Dashboard?
- More Than a Tool
What’s the best for you? Well, that depends. You’ll learn how to build a dashboard that works for your business in this guide.
And good news if you’re thinking, "But what if I’m unique?" We’ll also show you how Flowlu can be your one-stop shop for building powerful business dashboards.
What is a Business Dashboard?
A business dashboard is a visual tool that pulls data from multiple sources together in a way that makes sense and helps you to make strategic decisions.
It collects all of your data at a centralized location to process it and then explains it through a real-time visualization so you can monitor your goals, stay informed, and quickly change things according to the requirements.
Why Do You Need A Business Dashboard?
Better Decision Making
Dashboards eliminate the need for scattered information or delayed reports and give decision-makers an overview of key data at a glance. Leaders can make data-driven, informed decisions faster and with more confidence with real-time updates and keep their business agile to changing circumstances.
More Productivity
A business dashboard helps teams spend more time doing and less time searching when all their data is on one screen.
Dashboards help streamline workflow and maintain project momentum by tracking tasks and providing real-time project updates so everyone is on track and on time.
Spotting Patterns and Trends
Dashboards are great at spotting patterns and trends around customer engagement, project bottlenecks, or sales spikes. Early detection of these trends allows businesses to adjust their plans to take advantage of opportunities or fix problems before they become bigger.
Must-Have Key Features of a Business Dashboard
Real-Time Data
Imagine having your project timelines, sales numbers, and customer feedback all in one place. And it updates instantly. No more tab flipping or chasing down the latest numbers.
A real-time dashboard lets you react quickly and stay on top. It allows you to close deals faster and even fix a project delay before it gets out of control.
Customization
Not everything works for everyone. Your sales team needs conversion rates. Your HR team? Maybe employee engagement stats.
A good dashboard lets you pick and choose what matters most. It’s like building a playlist—just the hits, no filler.
Simple & User Friendly
Data is useful only when you can use it. That’s the reason clunky dashboards are just a waste of time.
But a clean layout means you find what you need fast. A glance, instant insight. That’s how it should be.
How to Create a Business Dashboard Using BI Tools
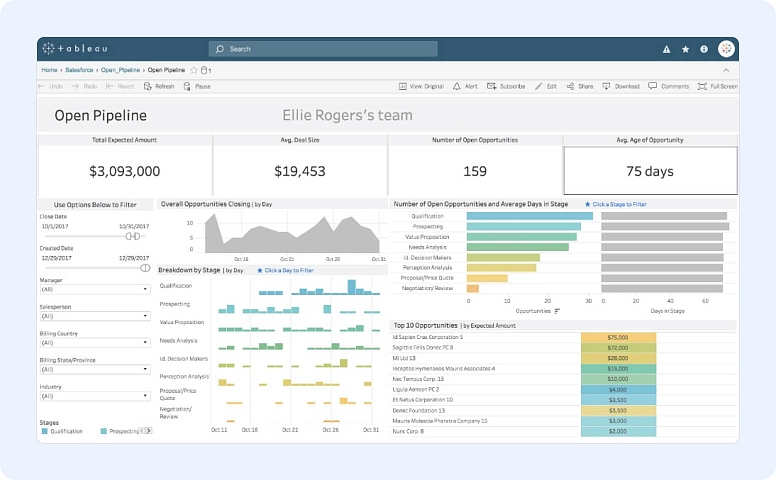
Advanced BI tools make it simple to create dashboards that bring all your key data together in one place. BI tools, or Business Intelligence tools, are software applications designed to analyze, visualize, and present data in a way that’s easy to understand and act on. Examples include Tableau, which specializes in interactive data visualization; Power BI, known for its integration with Microsoft tools; and Google Data Studio, a free option that works well with Google Services.
These tools help businesses track performance, identify trends, and make informed decisions based on real-time data. Let’s learn how to pick the right metrics, connect your data, and set up a dashboard in a BI tool that’s easy to use and share.
Step 1: Choose Your KPIs
Pick your business’s most important key performance indicators (KPIs). The right dashboard will focus on the metrics that align with your goals, whether that’s project schedules, financial health, or customer service response times.
By choosing these KPIs, you’ll ensure your dashboard shows what matters.
KPIs to Consider:
- Project Completion Rates: Monitor the percentage of projects completed on time.
- Sales Revenue Growth: Track sales over a set period.
- Customer Acquisition Cost (CAC): Measure cost of getting new customers.
- Team Productivity Metrics: Measure teams or individuals to improve workflow.
Step 2: Connect Your Data Sources
Usually, BI tools let you pull data from different tools and systems, including CRMs, project management software (like Flowlu), and financial tracking apps. Connecting these data sources means your dashboard will update automatically, no manual input is required.
Here are some important tips for connecting:
- Make sure your main data sources are linked and synced.
- Review sample reports after connecting to check data accuracy.
- Use tool integrations or API if you need to connect more tools.
Step 3: Layout Your Dashboard
Set up your dashboard according to your workflow and priorities. Frequently, BI tools offer various widgets like charts, graphs, task lists, and budget progress indicators. Arrange these widgets clearly and logically so you can always see what matters most.
Here are some Ideas for Layout:
- Put your key KPIs at the top of the dashboard for quick visibility.
- Group related metrics together, e.g. budget and spending.
- Use different colors to highlight sections and make it easy to find.
Step 4: Add Alerts and Notifications
One of the best dashboard features is setting up alerts to keep everyone in the loop. BI tools let you set up notifications for specific situations, e.g. when a project is at risk of missing a deadline or when expenses are about to hit a limit. These real-time notifications help teams respond quickly and stay on track.
Examples of Alerts to Set:
- Project Deadline Alerts: Notify team members as deadlines approach or when timelines slip.
- Budget Threshold Notifications: Send alerts when spending hits a certain percentage of the budget.
- Task Status Updates: Notify team leads when important tasks are complete or delayed.
Step 5: Share & Collaborate
BI tools make it easy to share dashboards with team members or clients. This keeps communication open and everyone aligned on current progress.
Sharing dashboards means everyone can access the same information for internal meetings or client updates.
Best Practices for Sharing:
- Set viewing or editing permissions based on team roles to keep data secure.
- Schedule regular team check-ins using the shared dashboard for updates.
- Use the dashboard as a visual aid during meetings for quick, informed discussions.
How to Create Your First Business Dashboard with Flowlu
Building a business dashboard with Flowlu is simple and gives you clear, actionable insights. Follow these steps to create a dashboard that works for you and boosts productivity:
Step 1: Start with a New Page
- On the home page, click the plus (+) button to create a new page.
- Give your page a name that reflects its purpose, such as "Financials" or "Task Overview."
Step 2: Add Widgets
- Click the Add button to begin adding widgets to your dashboard.
- Widgets are grouped by modules like Tasks, Finance, Projects, CRM, and Knowledge Base.
- Each widget can be easily duplicated, and every widget comes with its own unique settings to better adjust to your needs. For example, Financial widgets typically allow you to select the organization for which you want to display results or define a specific time period. Or, Task widgets offer a wide range of filters, including status, assignees, priority, and more.
- You can create separate pages for each module or combine all essential indicators on one page. The choice is yours.
Step 3: Arrange Widgets
- Drag and drop widgets to place them wherever you want.
- Resize them to suit your preferences and make your dashboard visually appealing.
- If you need help arranging them, hit the Reorder button, and Flowlu will optimize the layout for you.
Step 4: Fine-Tune Your Dashboard
- Review your layout and ensure all important information is easily accessible.
- Adjust widget sizes and positions as needed to get the perfect balance of clarity and functionality.
And that’s it! You’ve got a custom dashboard ready to give you insights at a glance. Whether it’s tracking tasks, monitoring finances, or keeping an eye on projects, your Flowlu dashboard is there to keep you on top of things.
Top Use Cases for Dashboards
Dashboards can do more than just show numbers—they can change how teams think, react, and plan around data. Are you using dashboards to their full potential? Let’s dive in and see:
A. Project Management and Tracking
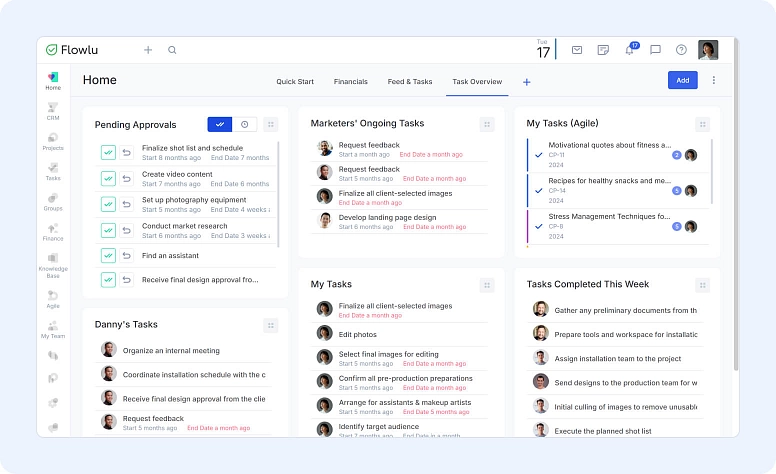
Are your projects on track or are there hidden bottlenecks? Dashboards are a project manager’s best friend because they show task status, upcoming deadlines, and resource allocation.
This gives everyone a bird's eye view and keeps everyone aware of their role and progress.
Practical Tip: Review your dashboard regularly for overdue tasks or resource conflicts. Having this front and center helps teams adjust in real-time before small issues become big problems.
B. Sales and CRM Insights
Is your sales team using their data or are opportunities slipping through the cracks? Dashboards for sales teams can show the health of the sales pipeline, current deal stages, and how close they are to hitting monthly targets. Once you integrate your CRM tool with BI software, it makes tracking every customer interaction effortless. This helps teams refine strategies and boost client satisfaction.
Questions to Ask:
- Are your deal stages on track or are there patterns of slowing down at certain points?
- How does your team compare to previous periods for revenue trends?
Use the dashboard to highlight high-priority deals and set alerts for big pipeline changes that need attention.
C. Financial Overview
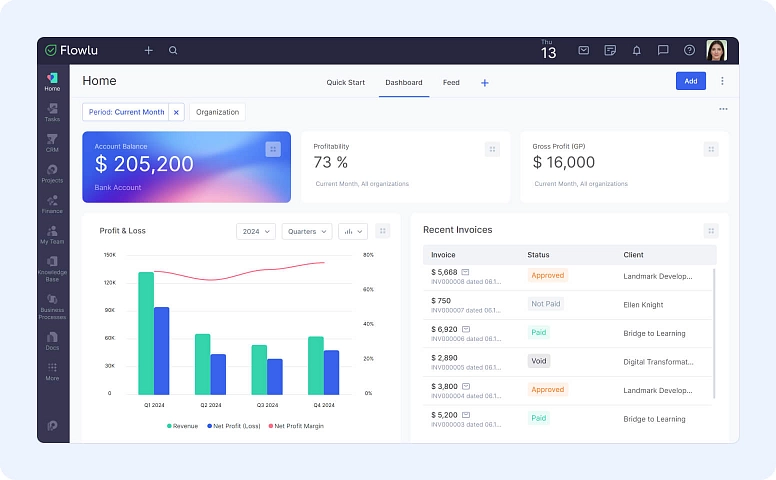
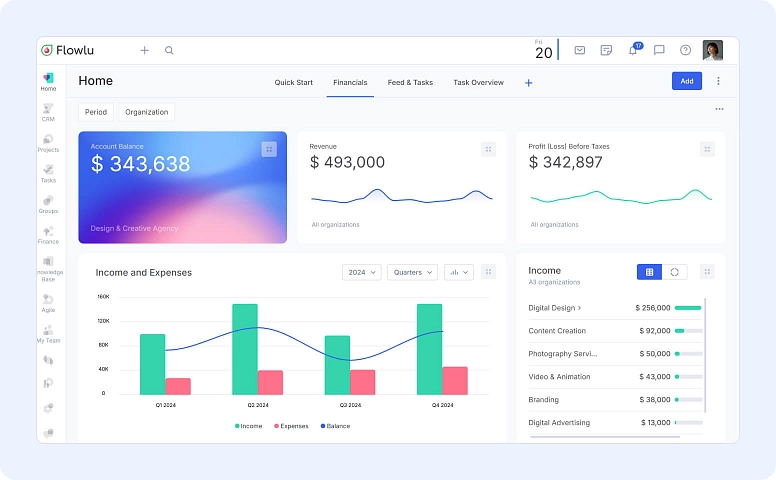
Do you see the whole financial picture or just snapshots? CFOs and financial teams need fast and accurate data on cash flow, expenses, and profit margins.
With Flowlu’s financial dashboards, businesses can combine revenue growth figures, operational costs, and profitability ratios to plan the budget.
Financial Dashboard Tips:
- Show month over month to see financial trends.
- Use green and red flags to see if profit margins or expenses are above or below target ranges.
Dashboards for Results
Creating a business dashboard is just the start. Keeping it updated and useful is where the real work begins. Are you maintaining your dashboard in a way that continues to provide value as your business grows?
Here’s how to make your dashboard work for you:
A. Regular Updates and Reviews
Is your dashboard keeping up with your business's changing needs? Your KPIs, data sources, and priorities will change. Regularly reviewing and updating your dashboard ensures that it reflects the most relevant and actionable data. Without this, outdated or irrelevant data could mislead your team, affecting decision-making.
Pro Tip: Schedule quarterly dashboard reviews to check if your KPIs are aligned with your goals. This will ensure your dashboard is a progress tracker.
B. Train Your Team
Are your team members using the dashboard to its full potential? Even the basic dashboards need some training. Ensuring your team knows how to read the data and navigate the dashboard maximizes its benefits. With Flowlu’s user-friendly interface, this step becomes easy.
Actionable Step: Hold a quick training session or create a tutorial that walks your team through the dashboard features. Also, you can use an AI video generator tool to create animated characters that explain the features in a fun way. This investment in education will pay off in increased productivity and reduced confusion.
C. Get Feedback
Is your dashboard working for everyone on your team? You should get feedback from your team and find out where the gaps are. Maybe there are widgets they don’t use or crucial data missing. Regular input from the dashboard's users ensures it stays relevant and user-centric. Feedback is the best way to refine the design and functionality so it does what it’s meant to do.
Why Use Flowlu for Your Business Dashboard?
While many tools can create business dashboards, Flowlu is the only all-in-one platform for businesses of all sizes. Here’s why Flowlu for your business dashboard:
1. One Stop Shop
Flowlu has project management, CRM, invoicing, financial reporting, and more in one place. This consolidation means you don’t have to juggle multiple software tools to create a dashboard that has all the data from multiple departments.
Tip: By using Flowlu’s all-in-one solution you reduce data silos and get information flowing across departments so everyone has access to the same up-to-date information.
2. Customisable and Scalable
Is your dashboard flexible enough to grow with your business? Whether you’re just starting or you’ve scaled into a large enterprise Flowlu’s custom widgets and flexible data sources allow you to tweak and expand your dashboard as your business evolves.
Regularly check if your dashboard can handle the complexity as your business grows. Flowlu makes it easy to scale so your dashboard always reflects your current needs without being overwhelming.
3. User Focused Design
Does your dashboard cater to users of all technical abilities? Flowlu’s interface is designed to be user-friendly. Whether your team members are tech-savvy or not they can use the dashboard easily.
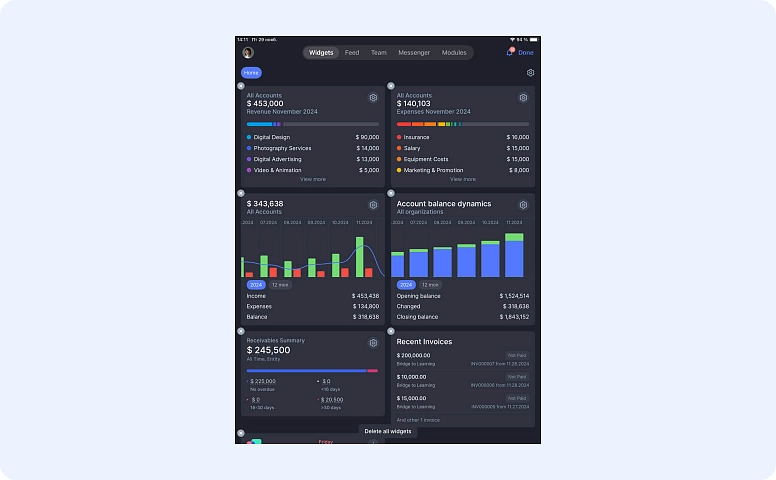
Plus Flowlu’s mobile app means your team is connected and informed wherever they are. Flowlu also supports iPads, giving you a bigger screen and more space to comfortably view dashboards and analyze data with ease.
More Than a Tool
A business dashboard helps your team stay productive by showing key data in real time. With Flowlu, you can easily create and customize one to match your business needs.
Think about this:
- You’ll have an up-to-date view of your business at all times.
- Your team will spend less time searching for information and more time making decisions.
- You’ll have clarity on progress towards goals and adapting strategies in real-time.
With Flowlu you manage your business and set it up for consistent growth. Start your dashboard today and see how your team stays in sync and on track!
A business dashboard brings all your important data into one place so you can see what’s happening without hunting for information. It gives you a clear view of your goals, updates in real time, and helps you adjust quickly if something changes.
Check your dashboard regularly to make sure it’s showing the right information. Update the key stats you’re tracking, connect any new tools you’re using, and ask your team if there’s anything missing. Keeping it simple and relevant makes all the difference.
Flowlu combines tools like project management, sales tracking, and financial reporting in one place. This means your dashboard can pull data from different areas of your business easily. Plus, it’s simple to set up, easy to customize, and grows with you as your needs change.


