11 Alternatives to Gantt Charts You Should Consider
Have you experienced difficulties while preparing a Gantt chart? Do these problems occur so often that you’re looking for another way to illustrate your project schedules? In this article, we’ll explore the best alternatives to Gantt charts as well as provide recommendations on how to choose a suitable substitute.
What is a Gantt Chart?
Henry Gantt pioneered the concept 10 years after the turn of the century for routine operations like measuring employee productivity. It soon became a staple in project management and was used in big infrastructure projects like the Interstate highway system and the Hoover Dam.
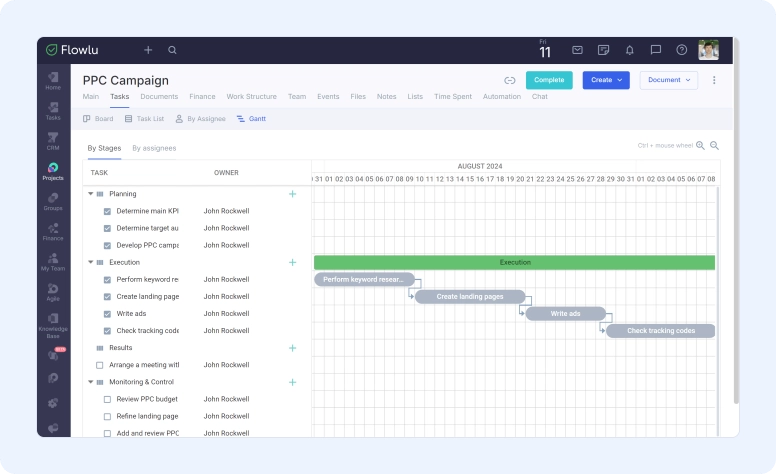
A Gantt chart shows all parts of a project’s life cycle in bar charts. The two axes help you organize project information. You can see tasks, resources and the whole project schedule at a glance. A Gantt chart can be made with dedicated programs. These systems have many nice features, except they are not free to use. Sometimes it’s cheaper to do it the old fashioned way, on paper.
Pros and Cons of Using a Gantt Chart
In short, Gantt charts show the whole list of tasks and how they relate to each other over a certain timeframe. There are many benefits to this but let’s look at some of the main ones:
-
It gives you an overall view of the project. You can easily see where each piece fits and spot problems without having to switch tabs or flip through website pages.
-
It shows tasks dependencies and the critical path. The Gantt chart helps to deal with tasks or resources that are causing problems.
-
It allows you to see multiple schedules. The Gantt chart helps you find free time in your project timeline for new tasks.
Although Gantt charts are an easy and practical way to show project schedules they have some disadvantages. This makes them hard to use across all projects your company does. Here are some of the main ones:
-
Horizontal bars on a Gantt chart are misleading; each bar represents a task’s timeframe but not the hours required to complete.
-
New users will struggle to collaborate with their team while creating a Gantt chart. It’s time consuming and will leave your team members stressed and no actual work done.
-
As time goes by, updating a Gantt chart becomes a challenge itself. Changes in project scope or new tasks added will make it hard to keep track of everything.
Better Alternatives to Gantt Chart
#1: Timelines
A better Gantt chart alternative is a project timeline. The main difference is the number of dimensions. A Gantt chart uses 2 to demonstrate a sequence of tasks and their dependencies, a project timeline presents tasks and their due dates on a single horizontal line.
In the end it comes down to what you want to illustrate. If you just need a quick project overview a timeline is fine, if you need to show task dependencies of a complex project then a Gantt chart is best.
#2: Calendars
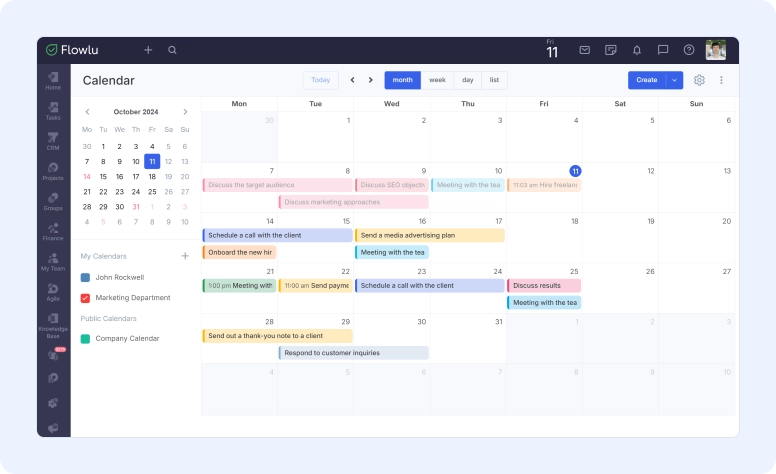
Calendars aren’t going out of fashion anytime soon. They serve a dual purpose, helping us to structure our daily lives and project management endeavors. A calendar allows us to align our schedules with important deadlines and events so we don’t overcommit our resources. We can use it for project planning, resource allocation, task division and so on.
While many of us are used to working with calendars, offline or on a Windows PC or Mac, there’s project management software like Flowlu that has a calendar to help you plan your personal and work activities. For example you can get reminded of project and opportunity events. Sync a calendar with Google Calendar and use the app on your iPhone or Android device to plan on the go.
#3: Task Lists
Who doesn’t use task lists? You open an application to manage your to-do’s or maybe you write them down in a notebook. For a project manager, a task list is a nice to have, not a must have.
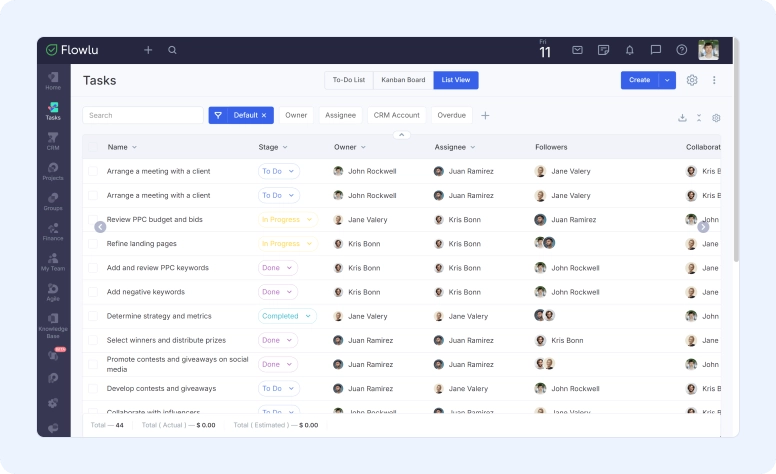
Task lists are a fantastic Gantt substitute since you can make one with almost any tool. This gives you the freedom to choose a tool you, your team and of course your stakeholders are already familiar with.
In Flowlu, you can view tasks in list format with various sorting and filtering options. This allows you to refine your search, making it easier to find exactly what you need.
#4: Checklists
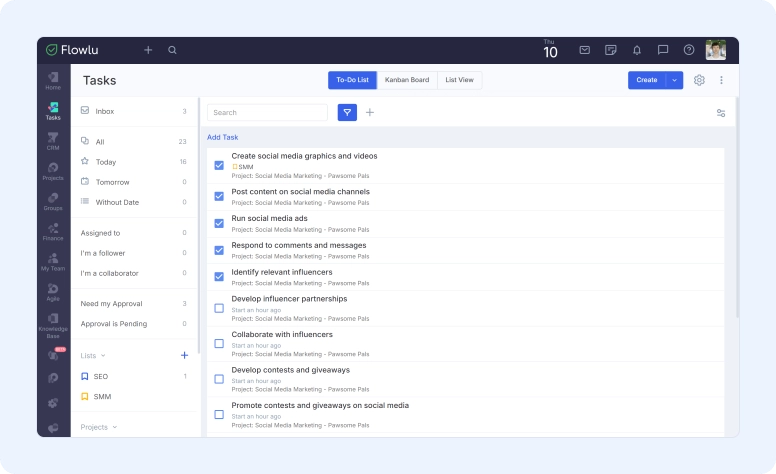
A checklist is, in many ways, similar to a task list. The main distinction is that the former outlines what must be done in order to accomplish a specific objective. This method allows you to organize and manage all the steps within a project. The added bonus is that when a task is completed, you or your employees can simply check off the assignment and advance to the next one.
#5: Work Breakdown Structure (WBS)
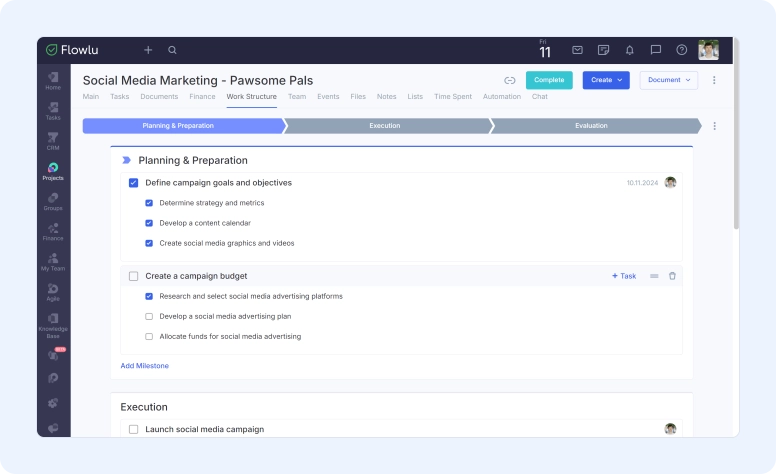
A work breakdown structure, or WBS for short, is a graphical representation of a project that segments the steps and tasks into smaller, digestible sections. This makes it easier to manage the workload and helps teams understand their responsibilities. All related tasks are grouped together, optimizing resource allocation. A WBS chart doesn’t include a timeline; that’s why it is commonly used to show task relationships and the order of completion.
#6: Kanban Boards
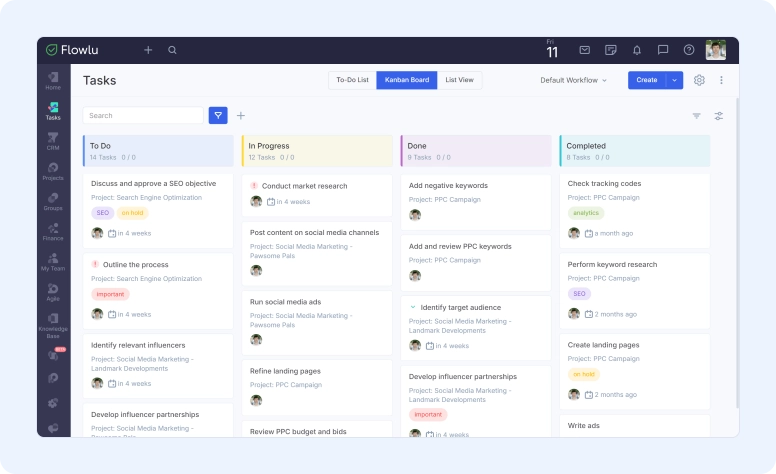
Kanban boards are popular because you can use them for many projects. This becomes even more obvious when they go digital and become part of project management software. These boards are made up of task cards and columns that show a stage of completion. This visualization lets you clearly see progress on a project.
Flowlu has Kanban boards in many of its modules so you can manage projects, plan underlying tasks and more. This view shows items on a board that’s divided into columns that reflect your project stages or task status.
#7: Scrum Boards
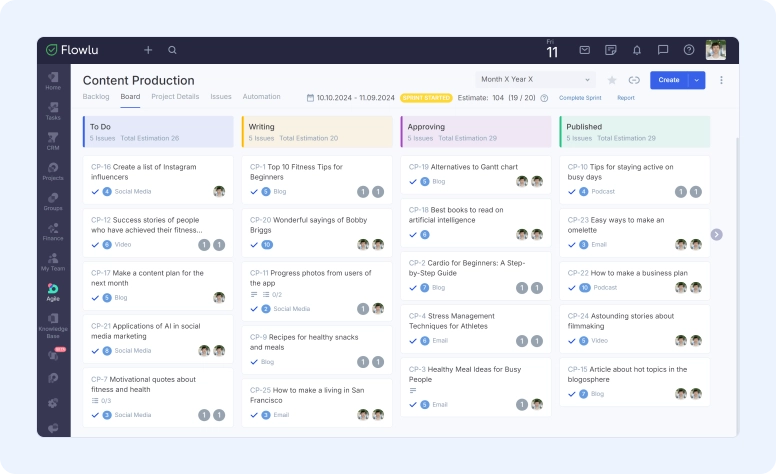
For projects that need flexibility, scrum boards are your go to. They’re a better alternative to Gantt charts every step of the way. On a scrum board, projects are organized into sprints just like on a Kanban board. This format uses directional lanes to track tasks in each sprint, usually labeled “Backlog”, “To Do”, “Doing”, “Done” and you can move the task’s priority if needed.
#8: Flowcharts
One Gantt project alternative is a flowchart, a simple diagram to visualize the tasks and workflows of a project. It’s meant to clarify the project plan by showing the order of tasks. A big advantage of this approach is that it allows project managers to communicate the project scope to stakeholders, investors and team members.
#9: Mind Maps
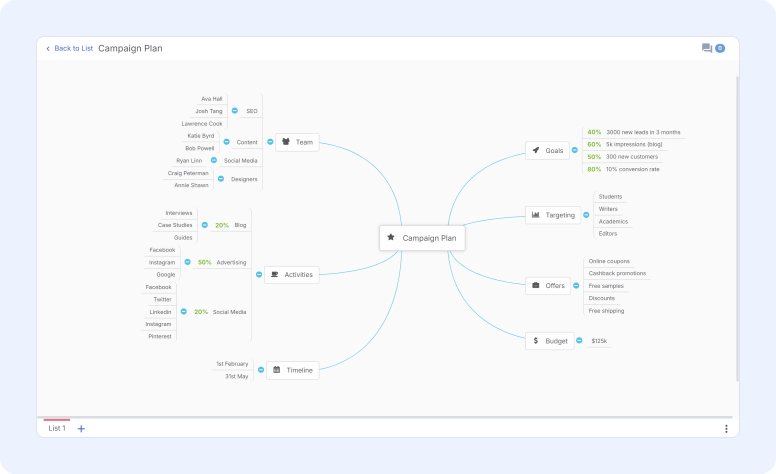
Next on our list of Gantt alternatives is the mind map, which is perfect for brainstorming sessions. At the center of the diagram, you’ll find a main idea or question, with lines radiating outward to connect associated concepts. The process continues, linking ideas at each level.
Mind maps are great for showing relationships between project elements and how they relate to the main purpose of the project. Flowlu’s mind maps are collaboration friendly. You can give your team access to create, edit and discuss. An external link means you can share your mind map with contacts or on social media sites.
#10: PERT Charts
PERT is the chief competitor of Gantt. It’s a project management tool that helps you estimate total project duration, identify task dependencies, sequence tasks and highlight the critical path. Gantt charts are limited to the execution phase of the project; PERT can be used in project planning and execution phases. In visual terms, it’s a network diagram, tasks are boxes that list their names, start and finish dates and duration. Arrows connect the boxes to show the order and relationships.
#11: Dashboards
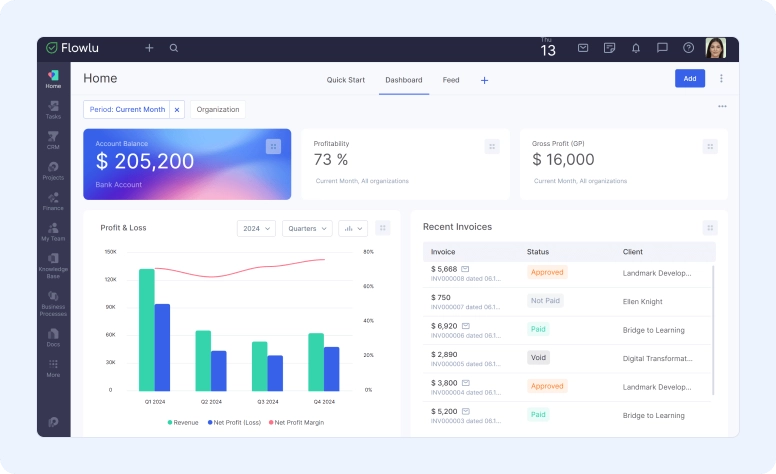
Dashboards are great alternatives to Gantt. They consolidate multiple information sources, metrics and key performance indicators (KPIs) in one view. With text and widgets you can access project data in real-time and make decisions. In Flowlu, you can add elements from different modules, like finance or tasks and move them around. And you can also see similar projects by moving them into the portfolio.
How to Choose a Gantt Chart Substitute?
You have an idea, and now it’s time to outline all the tasks involved. Will you draw up a project timeline? Create a task list? Break down sprints on a scrum board? As you can tell, there are numerous substitutes for a Gantt chart. The main question is—what do you want the analog to accomplish?
-
Initial project planning: mind maps, flowcharts, calendars.
-
Complex project with task dependencies: scrum boards, flowcharts, dashboards.
-
Multiple projects in work: Kanban boards, scrum boards, dashboards.
-
Client presentation: timelines, task lists, flowcharts, dashboards.
Flowlu - All-in-One Gantt Replacement
Project managers are always on the lookout for the perfect formula or magic trick to streamline their day-to-day activities. It’s essential to experiment with various techniques and choose the one that best fits your project and workflow. Pairing it with powerful project management software will steer you toward success.
Flowlu is a comprehensive yet user-friendly solution for managing projects. It comes with mind maps to brainstorm ideas, calendars to organize your schedule, Kanban boards to keep track of tasks, and customizable dashboards to collect and present data from various sources. These features are complemented by finance management, instant messenger integrations, online file storage, client portal, and more to deliver an all-encompassing business platform for your project management needs.
As technologies evolve, some things stay the same. Introduced in the early 1900s, the Gantt chart continues to be the go-to tool for project management professionals. The diagram visually represents tasks, deadlines, and the project completion status. It benefits everyone, from a small business owner to a head of a big corporation.
Despite being commonly used, Gantt charts have several disadvantages:
- Collaborating on creating a chart is difficult and takes up a lot of valuable time.
- Making changes is not simple and requires getting input from other members of the team.
- Graphical representation of a project’s life cycle does not indicate priorities of particular tasks.
- Task bars do not demonstrate the amount of time needed to complete in measurable quantities.
The Gantt chart is a handy tool for project management, especially if you need to accurately schedule and plan tasks. Nevertheless, it cannot be used in every scenario. Let’s look at some areas where using a Gantt chart is not necessary:
- Initial planning: Gantt charts are best used in the execution stage of a project as they are less flexible compared to mind maps, for example.
- Resource management: Gantt charts are excellent at presenting the amount of time required for completing a project and its related tasks. It falls short in terms of breaking down all resources involved for manufacturing products or delivering services.
There are a lot of options when choosing a clone to a Gantt chart. Keep in mind that each substitute comes with its own pros and cons. Consider what you want to use it for. When developing initial plans, mind maps and flowcharts are useful. For managing work on multiple projects, Kanban boards and scrum boards are a must.
PERT stands for Program Evaluation and Review Technique. Similar to Gantt, PERT chart is used to schedule, organize, and outline project tasks, visually illustrating a project timeline and the breakdown of tasks. This approach can be employed during both planning and execution phases of a project.


