




60 E-commerce Stats for 2026: Global, Mobile, and Social Commerce


The driving forces behind this boom are mobile commerce and the rise of social shopping. Mobile devices now account for a majority of all online sales, making the smartphone the go-to device for today’s shoppers.
At the same time, social media platforms are transforming discovery of products into direct purchase points, with social commerce expected to generate trillions of dollars as users shop online via their favorite social media sites.
This report presents you with up-to-date statistics that will help you understand the current ecommerce market situation and strategize for the coming years.
This analysis covers high-level sales and pure shopping data, and also looks at operational factors from managing shipping and delivery expectations to mitigating the rising costs of returns and online fraud.
Look at the real data and ensure your business is in the best position for growth in the online commerce industry.
Top Ecommerce Facts for 2026
Let’s highlight the most important ecommerce stats that define the market today.
- Over three billion people now buy something online entering 2026.
- Worldwide ecommerce sales have surpassed $6.42 trillion entering 2026.
- Social commerce sales have exceeded $1.17 trillion globally.
- Mobile commerce now accounts for nearly 59% of total online retail sales.
- Amazon accounted for 35.7% of the total U.S. online retail market in 2025.
Ecommerce by the Numbers: Key Market Insights for 2026
This quick overview covers ecommerce markets, platforms, traffic sources, and customer behavior.
| Key ecommerce statistic | Figure |
| China market | Nearly $1.5T |
| U.S. market | $1.17T+ |
| Philippines market by 2030 | $18.82B |
| Shopify + Wix share of ecommerce-tech websites | 46.5% |
| Organic search share of ecommerce traffic | 43% |
| Mobile share of web traffic | 60%+ |
| Cross-border shoppers | 52% |
| Online sales expected to be returned | 19.3% |
Global Ecommerce Statistics

E-commerce sales worldwide are rapidly growing. People turn to online shopping both out of convenience and as a hobby. I’ve taken a global look into ecommerce industry statistics so you can make better decisions for the future.
1. Ecommerce sales have surpassed $6.42 trillion entering 2026
Worldwide ecommerce sales estimated to have exceeded $6.42 trillion going into 2026. The valuation is immense. It shows the scale of the market. Every online business must adapt to increase this number even further.
2. Ecommerce growth is projected to hit $7.89 trillion by 2028
Ecommerce sales are forecasted to grow to $7.89 trillion by 2028 on a global scale. Its trajectory is clear, steady, and positioned to sell more.
3. Over three billion people now purchase online annually
Online shopper statistics show that more than three billion people will make a purchase online in 2026. This makes nearly half of the global internet population of active online shoppers.
4. Online sales will account for a quarter of global retail by 2027
By 2027, online sales are expected to make up close to a quarter of total global retail sales 22.6%. This dramatic increase in share shows the ongoing dominance of e commerce in the world.
5. China remains the leading e-commerce market worldwide
China will be the largest ecommerce market for the next few years. It is shadowed by the United States. Their continued spending is estimated to keep these markets in the top place worldwide.
6. US ecommerce sales have surpassed $1.17 trillion
Ecommerce sales in the United States are expected to reach over $1.17 trillion entering 2026. By all accounts, U.S. ecommerce is the second largest market.
7. Global B2B ecommerce sales stand at over $32 trillion in 2026
The global B2B ecommerce market is expected to exceed the mark of $32.11 trillion in 2026. There are rich opportunities for companies selling to other businesses.
Small ecommerce teams that use CRM software for small business can manage leads, orders, and customer communication without outgrowing their budget.
Online Shopping Statistics

Of course, businesses want to know what drives consumers’ purchasing decisions. In the following online shopper statistics I focus on behavior, buying habits, and the motivation behind a typical online purchase.
8. Average shopping cart abandonment rate is 70.22%
The average shopping cart abandonment rate is 70.22%. E commerce websites with streamlined checkout experiences see a smaller number of abandoned carts. This is one of the clearest statistics on e commerce. But when websites offer streamlined checkout experiences, the rate declines.
9. 90% of shoppers abandon their purchases due to high shipping costs
Over 90% of shoppers tend to abandon their online purchase if they discover that the shipping costs are too high. Shipping is less about convenience and more about customer expectations. Statistics on e commerce show just how much it matters.
10. Free shipping remains a key factor in online purchases
74% of shoppers are more likely to complete a purchase when delivery is free. Offering free shipping can help retailers reduce purchase hesitation and encourage customers to complete their orders.
11. Nearly 99% of shoppers check product reviews before a major purchase
99% of shoppers read product reviews before making a major purchase. Ecommerce platforms must ensure that all products have customer feedback to help with conversion. This is one of the most relevant online shopper statistics for businesses that rely on detailed listings to drive sales.
12. Half of online purchases are driven by Millennial and Gen Z shoppers
Half of consumers making online purchases are from the Millennial and Gen Z demographics. This younger demographic represents the total future of the ecommerce industry.
13. 85.6% of consumers shop online at least once per month
Roughly 85.6% of consumers use online platforms for shopping at least one time per month. That’s a massive increase in digital shopping frequency across worldwide users. These online shopper statistics show that regular purchasing is now part of everyday consumer behavior.
Shopping frequency matters because repeat purchases compound over time. The more often customers buy and the longer they stay, the more value each relationship generates.
To see how purchase frequency and retention affect revenue in your store, you can estimate it using a free Customer Lifetime Value (CLV) calculator.
14. Fashion is a nearly trillion-dollar e-commerce market
Fashion continues to be one of the biggest categories in online retail. Global fashion e-commerce revenue is projected to reach $957.31 billion in 2026, putting the market within reach of the $1 trillion mark. Statista projects it to reach $1.16 trillion by 2030. These figures add to the broader ecommerce industry statistics and show how individual ecommerce categories scale.
15. 87% of consumers say the product description is the most important factor
When a customer cannot inspect an item in person, 87% of consumers believe the quality of the product description is the most important factor when deciding on a purchase. Comprehensive and accurate website content helps with conversion. These online retail statistics explain why comprehensive and accurate website content matters for conversion.
16. Personalization can turn browsing into buying
74% of U.S. consumers are more likely to purchase when they receive a truly personalized recommendation. Relevant product suggestions and tailored offers can make the shopping experience more engaging and encourage customers to buy.
17. 52% of global shoppers buy from international retailers
More than half, 52% of online shoppers, report buying products from retailers in other countries. There is an enormous opportunity for international ecommerce growth and cross-border sales.
18. 43% of ecommerce traffic comes from organic Google search
43% of all ecommerce website traffic comes from Google's organic search results. SEO is not dead. It’s not replaced by GEO or AEO. SEO is a critical part of any modern ecommerce strategy.
19. Philippines is one of the fastest-growing ecommerce market worldwide
The Philippines has one of the fastest-growing ecommerce markets. It has a projected market volume of $18.82 billion by 2030. Emerging markets are taking their share of the worldwide economic growth.
Mobile Commerce Statistics

Mobile commerce, or m-commerce, is now the dominant channel for online sales worldwide. These mobile shopping statistics tell us how important mobile optimization is for any respectable ecommerce business. Also, together, these figures form an important part of current online retail statistics.
20. Mobile commerce is expected to account for nearly 60% of total online retail sales
Mobile commerce will account for nearly 60% of total online retail sales (or $4.01 trillion) in 2026. Mobile devices are easy to carry, and now extremely easy to use for online shopping.
21. 1.65 billion people are expected to shop via smartphone in 2026
Approximately 1.65 billion people are expected to shop via smartphone in 2026, which is one-third of the global digital population. Omnipresence of mobile devices continues to drive commerce growth.
22. Mobile shoppers favor apps over mobile websites
85% of U.S. mobile shoppers prefer using apps rather than mobile websites for online shopping. A dedicated shopping app can offer a more convenient experience and give customers additional reasons to return.
23. Number of smartphone users will reach six billion by 2027
The number of smartphone users globally is expected to reach 6 billion by 2027. There is a massive audience of smartphone users. Most will use their phone at least once to buy something. Mobile commerce is a land of opportunities.
24. Mobile devices will exceed 60% of all online web traffic in 2026
Mobile devices account for over 60% of all web traffic online entering 2026. Mobile is starting to become the first place to search for products and services.
25. Mobile devices generate 78% of all retail website traffic
Smartphones generate nearly 78% of retail website traffic globally. Mobile devices give by far the easiest access to online stores. Design and optimize your landing pages to target the mobile audience first.
26. Mobile shopping carts have an abandonment rate of 85.65%
Despite the high mobile traffic, mobile shopping carts face a significantly higher abandonment rate of 85.65%. The complexity during checkout is often cited as a major challenge for mobile commerce.
Social Commerce Statistics

The integration of shopping directly within social media platforms led to a real social commerce boom. The social selling market is fast. Retailers have to adapt their propositions to these conditions to be able to reach consumers now and in the future.
27. Global social commerce sales will surpass $1.17 trillion in 2026
Global social commerce sales are projected to exceed $1.17 trillion in 2026. Shopping via social media is a profitable mechanism. This commerce trend with a social angle will continue to bring in new customers. The figure is also an important part of broader ecommerce stats for 2026.
28. U.S. social commerce sales will exceed $80 billion in 2026
Social commerce sales in the United States are forecast to exceed $85.58 billion in 2026. This makes the United States the second largest social commerce market after China.
29. Facebook will reach 80 million social shoppers in the US in 2026
Facebook is one of the main social media platforms, with a forecasted reach of more than 80 million social shoppers in the United States by 2026. The massive audience and presence of influencers make it one of the primary pillars of social commerce.
30. 1.4 billion people use Instagram for shopping online
Instagram offers a native social commerce experience as it allows users to purchase without leaving the platform. 1.4 billion people take advantage of this functionality.
31. 44% of Instagram users shop on the platform every week
According to Instagram’s own survey, 44% of its users shop on the platform every week. There’s a powerful and recurring spending habit among its audience.
32. TikTok Shop continues to accelerate social commerce
According to eMarketer, TikTok Shop's U.S. sales grew 84% from March 2025 to February 2026. The platform's rapid growth highlights how social content, product discovery, and in-app shopping can come together in one experience.
33. Millennials account for 33% of social commerce spending
The largest demographic in the market is Millennials at 33%, closely followed by Gen Z standing at 29%. High engagement with social media and tech-adaptability of both generations make them a valuable target audience.
34. Social commerce will account for over 17% of total online sales in 2026
Sales through social networks are expected to represent over 17% of total online sales in 2026. Social selling is no longer experimental; it has proven its value as a powerful channel for sales.
35. Social media is becoming part of the buying journey
Around 84% of consumers search for brands on social media before making a purchase. Social platforms can help customers discover products, research brands, and move closer to a purchase decision.
36. Asia-Pacific market accounts for 90% of global social commerce
The Asia-Pacific market is responsible for 90% of the global social commerce market value. Western businesses have to rethink their approaches to social media to keep up.
37. China remains a major live-commerce market
China continues to lead in live-commerce adoption. For example, McKinsey found that 87% of surveyed frequent live-shopping users attend live-shopping events at least once a month. What’s remarkable is that Chinese shoppers also tend to purchase directly during live streams. That makes livestreaming an important part of the country's social-commerce ecosystem.
Ecommerce Industry Statistics

The ecommerce industry landscape is dominated by a select number of top global platforms and retailers. Here are some valuable statistics to give you an idea of this world.
38. There are over 28 million ecommerce websites globally
As of 2026, there are over 28 million ecommerce sites worldwide. With so many websites publicly available, we understand now just how competitive the ecommerce market is. It also puts ecommerce industry statistics into context.
39. Amazon accounts for more than a third of U.S. e-commerce sales
Amazon generated roughly $440 billion in U.S. sales in 2025, representing an estimated 35.7% of the U.S. e-commerce market. This makes Amazon the largest online retailer in the U.S. by market share.
40. Walmart’s e-commerce sales increased nearly 22% to 26% year-over-year
Walmart's ecommerce sales increased nearly 22% to 26% year-over-year recent quarterly reports. This giant of retail is a leader of digital transformation both at home and on foreign markets.
41. Millions of online stores use platforms like Shopify worldwide
The total number of online stores is difficult to track precisely, Shopify alone hosts millions of unique websites and online commerce storefronts worldwide (4.82 million active stores as of 2025).
42. Shopify and Wix power nearly half of all ecommerce sites
Shopify and Wix Stores are used by more than 11 million live websites combined. Together, they account for roughly 46.5% of websites using e-commerce technologies tracked by BuiltWith. This makes them the two most widely used e-commerce platforms in its current data.
43. Grocery is expected to top U.S. online sales categories in 2026
The online grocery market is forecast to lead U.S. online sales in 2026. This shows that ecommerce continues to mature as it captures perishable goods, a trend reflected in online retail statistics.
Ecommerce Delivery Statistics
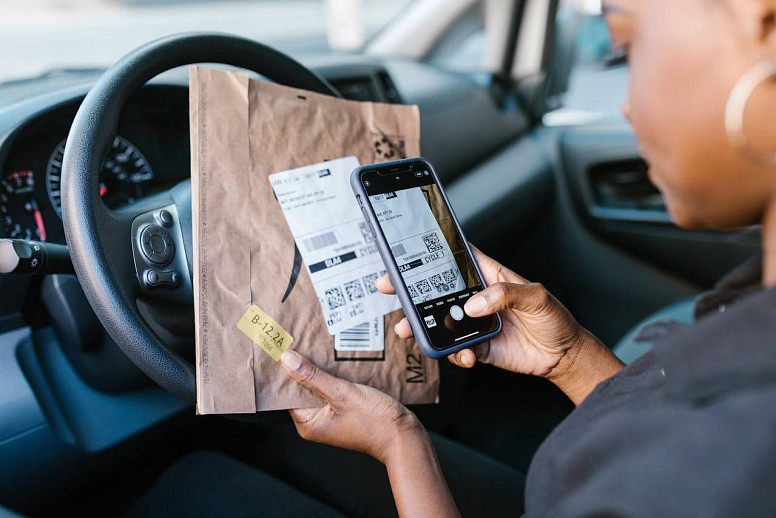
I’ve dedicated this section to the operational realities that dictate profitability in modern ecommerce. This includes the rising costs of reverse logistics and increasing threats of fraud.
44. Nearly 1 in 5 online sales were expected to be returned in 2025
The National Retail Federation and Happy Returns estimated that 19.3% of online sales would be returned in 2025. This forecast shows that it’s essential for ecommerce businesses to build an effective management strategy that helps control costs and maintain ecommerce profitability. These statistics on e commerce also give us a better idea of what it takes to run an online store.
45. Retail returns were expected to cost $849.9 billion in 2025
The same source estimated that retailers would receive $849.9 billion worth of returned products in 2025. That’s a huge amount, so a simple and efficient returns process can help businesses control costs and protect profits.
46. Ecommerce fraud losses reached $56 billion in 2025
Global ecommerce fraud losses reached an estimated $56 billion in 2025. Fraud can cost businesses much more than the value of the fraudulent order itself. So if ecommerce companies have a strong fraud prevention strategy, they can protect their revenue.
47. Cost of online payment fraud will exceed $362 billion between 2023 and 2028
The cumulative merchant loss to online payment fraud will exceed $362 billion between 2023 and 2028. This makes cybersecurity and payment trust critical components of any ecommerce strategy.
48. Clothing has the highest return rate at 25%
Clothing has the highest return of any category, accounting for 25% of all ecommerce returns. Developing mechanisms for reducing clothing returns is a part of an ecommerce strategy that can give significant benefits to the business.
49. 82% of shoppers cite free returns as an important consideration
Up from 72% in 2024, 82% of shoppers in 2025 pointed to free returns as a decisive factor when making a purchase online. Free returns are a critical expectation now; they’ve come a long way from a perk to a standard.
50. 32% of shoppers expect their orders within two hours
In 2025, 32% of global consumers expected their online orders to arrive within two hours. At the same time, 40% said they wouldn't order from a retailer that doesn't offer next-day or scheduled delivery. So, if you offer fast and flexible delivery, you’re more likely to attract buyers.
51. Easy returns can bring customers back
Shopify cites Attentive data showing that 22% of shoppers said easy returns and exchanges would make them most likely to shop again with a retailer. Positive post-purchase customer service can make customers come back and purchase again.
Online Shopping Trends Statistics
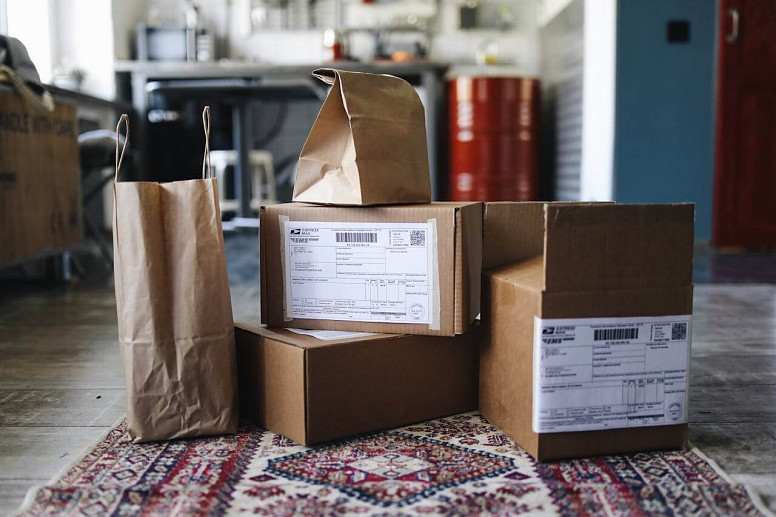
This section gives us a glimpse of the future of ecommerce. It’s dominated by faster adoption of technology, internationalization, flexible payment methods, and sustainable practices.
52. AI in e-commerce market is projected to reach $8.65 billion entering 2026
The AI in the ecommerce market is projected to reach $8.65 billion by the end of 2025. This substantial increase in spending will revolutionize online shopping over the next few years. These ecommerce growth statistics help us understand just how significant technology has become in the industry.
53. 80% of retail executives expected to adopt AI automation by 2025
80% of retail executives expected their companies to adopt AI-powered automation by the end of 2025. Executives expect a lot from application of AI, with main areas being efficiency of processes and elevated customer service.
54. Buy now, pay later (BNPL) market is projected to reach $28.44 billion in 2026
The global BNPL market is projected to grow from $28.44 to $83.36 billion by 2034. BNPL is becoming a fixture in finance on a global scale. It’s not a fleeting trend, but a fundamental shift.
55. Gen Y and Z use BNPL as a payment option the most
According to the J.D. Power 2025 study, 43% of consumers belonging to Gens Y and Z use BNPL services. To cater to the buying habits and preferences of younger generations, businesses need to adopt BNPL ASAP.
56. China continues to lead the global ecommerce market
China remains one of the world's biggest online markets and is an important part of ecommerce statistics worldwide. Statista estimates that this country generated almost $1.5 trillion in online sales in 2024, compared with $1.2 trillion in the United States. This huge domestic Asian market has a growing international presence. And it continues to shape the global landscape.
57. 61% of online shoppers state that eco-friendly packaging influences their purchase decisions
Ryder E-commerce Consumer Study for 2025 tells us that eco-friendly packaging is still a major factor that impacts shoppers’ purchase decisions, with 61% saying it contributes. Investing in sustainable packaging is a worthwhile endeavor with good long-term prospects.
58. 90% of consumers are willing to buy from brands with sustainable packaging
A majority, 90% of consumers, are eager to buy from brands that provide sustainable packaging. There is an advantage for businesses that take environmental responsibility seriously.
59. 72% of consumers actively buy more environmentally friendly products
72% of consumers reported actively buying more environmentally friendly products than they did five years ago. It’s not a simple preference; this is a conscious effort to find products that align with their values.
60. Digital payments accounted for 66% of global ecommerce transactions in 2024
Digital payments (including digital wallets, BNPL, and crypto) accounted for 66% of global ecommerce transaction value in 2024. Digital is the preferred way for consumers to pay online. This behavior helps businesses understand why they should review ecommerce stats and prepare better plans for growth.
Bottom Line
The data shows that growth of the ecommerce sector is not going to stop in the foreseeable future.
Global sales are soaring and the number of active online shoppers is multiplying. Mobile is best for conversion, while social media is now a preferred medium for product discovery and direct shopping.
At the same time, there are risks: rising shipping costs, amplified returns, and online fraud. AI and security investments become a mandatory part of annual spending.
The statistics presented above give us a picture of where ecommerce is heading in 2026 and beyond. Now, it’s up to ecommerce businesses to examine the data, adapt, and take advantage of these trends, making them part of their forward strategy.
FAQ
Global retail ecommerce sales reached an estimated $6.4 trillion in 2025 and are expected to approach $9 trillion by 2030, according to Statista.
Online retail sales will account for 22.6% of total global retail sales by 2027.
The Philippines currently has one of the fastest-growing ecommerce markets globally, with a projected market volume of $18.82 billion by 2030.
The average shopping cart abandonment rate is 70.19%.
Global social commerce revenue is estimated to reach $585.9 billion in 2026 and is expected to grow to $928.7 billion by 2030, according to Statista.